
Advanced Kubernetes, Part 4: Autoscaling All the Way Down
- Intro
- The Horizontal Pod Autoscaler
- KEDA: scaling on events, and down to zero
- The Vertical Pod Autoscaler
- Adding nodes: Cluster Autoscaler and Karpenter
- Making scale-up faster
- Scaling down without dropping requests
- When autoscaling doesn’t happen
- Wrapping up
Intro
Part 3 was about getting a pod’s resource numbers right. This part is about what happens when the load changes and the right numbers change with it.
Kubernetes can scale in three different directions, and it took me a while to realise they’re separate tools that solve separate problems. You can run more copies of a pod, you can give each pod more CPU and memory, and you can add more machines to the cluster. Each one has its own autoscaler, and most of the trouble people have with autoscaling comes from those layers not lining up.
| What changes | Tool | Reacts to |
|---|---|---|
| Number of pods | Horizontal Pod Autoscaler (HPA) | CPU, memory or custom metrics |
| Number of pods, from 0 | KEDA | Events: queue length, schedules, and more |
| Size of each pod | Vertical Pod Autoscaler (VPA) | Observed usage over time |
| Number of nodes | Cluster Autoscaler or Karpenter | Pods that can’t be scheduled |
Here’s how they chain together when traffic goes up:
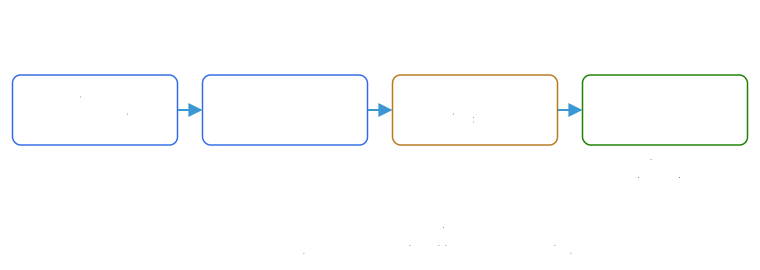
Keep that picture in mind. A lot of “autoscaling is too slow” complaints turn out to be the last step: the pods were created quickly, but they sat in Pending for two minutes waiting for a machine.
The Horizontal Pod Autoscaler
The HPA is built in, and it’s the one you’ll use most. It watches a metric for a Deployment (or StatefulSet) and changes the replica count to keep that metric near a target:
apiVersion: autoscaling/v2
kind: HorizontalPodAutoscaler
metadata:
  name: web
spec:
  scaleTargetRef:
    apiVersion: apps/v1
    kind: Deployment
    name: web
  minReplicas: 3
  maxReplicas: 20
  metrics:
    - type: Resource
      resource:
        name: cpu
        target:
          type: Utilization
          averageUtilization: 50
This says: keep the average CPU usage across the web pods at about 50% of their CPU requests, with never fewer than 3 pods or more than 20. It needs metrics-server running in the cluster, which is where kubectl top gets its numbers too.
How it decides
Every 15 seconds the HPA checks the metric and works out how many replicas it wants, using one simple formula:
desired replicas = ceil( current replicas × current value / target value )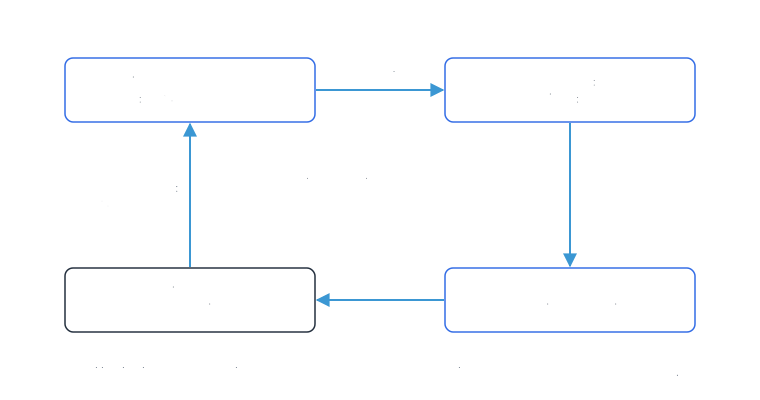
With 3 pods averaging 90% against a 50% target, that’s 3 × 90 / 50 = 5.4, rounded up to 6. If usage dropped to 20%, it would be 3 × 20 / 50 = 1.2, rounded up to 2, though minReplicas: 3 stops it going that low. There’s a 10% tolerance band, so tiny wobbles around the target don’t cause constant scaling. If you give the HPA several metrics, it works out a replica count for each one and picks the highest.
The most important word in that YAML is “requests”. Utilization is a percentage of each pod’s CPU request, not of the node’s CPU. This is where part 3 matters: if your requests are way too low, every pod looks like it’s at 300% and the HPA scales to the max. If they’re way too high, pods never look busy and it never scales at all. And if a container has no CPU request, the HPA can’t calculate utilization and simply doesn’t act. kubectl describe hpa will show a “missing request for cpu” message when that happens.
Controlling how fast it moves
By default the HPA scales up as soon as the numbers say so, but scales down slowly. It looks back over the last five minutes and uses the highest recommendation from that window, so a brief dip doesn’t remove pods you’ll need again in a minute. You can tune both directions with behavior:
spec:
  behavior:
    scaleUp:
      policies:
        - type: Percent
          value: 100        # at most double the pods...
          periodSeconds: 60 # ...per minute
    scaleDown:
      stabilizationWindowSeconds: 300
      policies:
        - type: Pods
          value: 2          # remove at most 2 pods per minute
          periodSeconds: 60
Slow, steady scale-down is almost always what you want. Scaling down too eagerly is how you get “flapping”: pods removed, load spikes on the remaining ones, pods added back, repeat.
Scaling on something other than CPU
CPU is a decent signal for request-handling services, and a poor one for a lot of other things. A worker reading from a queue might sit at low CPU while thousands of messages pile up. A Java service might be slow because of the garbage collector long before its CPU looks busy.
The HPA can scale on any metric the Kubernetes metrics APIs can serve. Requests per second per pod, queue depth or latency are common choices. To make those available you need an adapter, such as the Prometheus Adapter, that translates your monitoring system’s metrics into something the HPA can read. That works, but setting up the adapter is fiddly, which is a big part of why KEDA exists.
Two gotchas
If your Deployment’s YAML has replicas: 3 in it and you kubectl apply it (or your GitOps tool syncs it), you reset the replica count back to 3, whatever the HPA had scaled it to. Once an HPA manages a Deployment, take replicas out of the Deployment’s manifest and let the HPA own it.
The other is pod startup time. The HPA can add pods within seconds, but if each new pod takes 90 seconds to pass its readiness probe, your existing pods carry the extra load for those 90 seconds. Fast startup is part of autoscaling, even though it’s not in any autoscaler’s settings.
KEDA: scaling on events, and down to zero
KEDA (Kubernetes Event-driven Autoscaling) is a CNCF project that makes scaling on external events easy. It comes with dozens of ready-made scalers: SQS and Kafka queues, Prometheus queries, cron schedules, databases and lots more. You describe what to scale on with a ScaledObject:
apiVersion: keda.sh/v1alpha1
kind: ScaledObject
metadata:
  name: order-worker
spec:
  scaleTargetRef:
    name: order-worker
  minReplicaCount: 0
  maxReplicaCount: 50
  triggers:
    - type: aws-sqs-queue
      metadata:
        queueURL: https://sqs.ca-central-1.amazonaws.com/123456789012/orders
        queueLength: "20"      # aim for about 20 waiting messages per pod
        awsRegion: ca-central-1
      authenticationRef:
        name: keda-aws
Under the hood, KEDA creates and manages a regular HPA for you and feeds it the queue length as a metric. So everything in the HPA section above still applies.
What KEDA adds on top is scaling to and from zero. A plain HPA can’t go below one replica, because with zero pods there’s nothing to measure. KEDA watches the queue itself, so when it’s empty the worker can scale to zero and cost nothing, and as soon as a message arrives KEDA starts the first pod and hands over to the HPA. For workloads that sit idle most of the day, that’s a real saving.
KEDA also has a cron scaler, which is handy for “scale up before the 9am rush” when you know the traffic pattern in advance, and a ScaledJob resource, which starts a Kubernetes Job per batch of work instead of scaling a long-running Deployment.
The Vertical Pod Autoscaler
The VPA scales the other way. Instead of more pods, it changes each pod’s CPU and memory requests based on what the pods have actually used. It isn’t built in. You install it separately, and it has three parts: a recommender that watches usage, an updater that applies changes, and an admission webhook that sets the right requests on new pods.
It has a few modes. Off only makes recommendations. Initial sets requests when pods are created but never changes running ones. Recreate evicts pods so they come back with new requests. Newer versions can also resize running pods in place, using the in-place resize feature I mentioned in part 3.
Honestly, the mode I’d start with is Off. Point a VPA at a workload, let it watch for a few days, then read its suggestions:
kubectl describe vpa web
# look at "Target", "Lower Bound" and "Upper Bound" under Recommendation
That’s the data-driven version of the “picking the numbers” steps from part 3, and you stay in control of when the changes go in.
The one rule: don’t let the VPA and HPA both act on the same CPU or memory metric. The VPA raises requests, which lowers utilization, which makes the HPA remove pods, which raises utilization… and they fight. If you want both, have the HPA scale on a custom metric like requests per second, and let the VPA handle sizing.
Adding nodes: Cluster Autoscaler and Karpenter
Everything so far changes pods. None of it helps if the cluster is full. When the HPA adds pods and there’s no room, they sit in Pending (the scheduler from part 2 found no node that fits), and that’s the signal node autoscalers watch for.
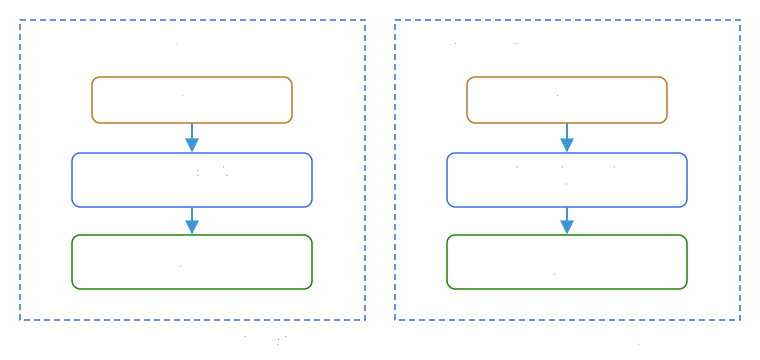
The Cluster Autoscaler is the long-standing option, and it works on most clouds. You define node groups (on AWS, Auto Scaling groups), each with one instance type. When pods are pending, it simulates whether adding a node to one of your groups would let them schedule, and if so, grows that group. It scales down too: a node whose pods’ requests add up to less than half its capacity for about 10 minutes is a candidate for removal, as long as its pods can be moved elsewhere.
Karpenter takes a different approach. Instead of node groups, you give it a set of rules (which instance families, architectures, zones, spot or on-demand), and it looks at the pending pods and launches whatever instance fits them best, straight from the cloud API. Ten small pods might get one medium node. A pod that needs a GPU gets a GPU node. It started on AWS and now has providers for other clouds too.
apiVersion: karpenter.sh/v1
kind: NodePool
metadata:
  name: general
spec:
  template:
    spec:
      requirements:
        - key: karpenter.sh/capacity-type
          operator: In
          values: ["spot", "on-demand"]
        - key: kubernetes.io/arch
          operator: In
          values: ["amd64", "arm64"]
      nodeClassRef:
        group: karpenter.k8s.aws
        kind: EC2NodeClass
        name: default
  limits:
    cpu: "200"           # never run more than 200 CPUs' worth of nodes
  disruption:
    consolidationPolicy: WhenEmptyOrUnderutilized
    consolidateAfter: 1m
That disruption block is Karpenter’s other big feature: consolidation. It keeps looking for ways to run the same pods on fewer or cheaper nodes, and moves things around to get there. In clusters with uneven load, that alone can cut the compute bill noticeably.
| Cluster Autoscaler | Karpenter | |
|---|---|---|
| You configure | Node groups, one instance type each | Rules for which instances are allowed |
| Picks node size | No, uses the group’s type | Yes, to fit the pending pods |
| Speed | Goes through the node group, a bit slower | Calls the cloud API directly |
| Cost optimization | Removes underused nodes | Removes and replaces nodes with cheaper ones |
| Clouds | Most major clouds | AWS, plus providers for some others |
Both need a way to create machines on demand, which means a cloud provider or something with an API that can create them. On a fixed set of physical machines, the node count is what it is, and the pod-level autoscalers have to work within it.
Making scale-up faster
Look back at the first diagram. The slowest step is waiting for a new node, and you can’t make cloud instances boot instantly. You can hide that wait, though.
The trick is overprovisioning: keep some spare room in the cluster, filled with placeholder pods that have a very low priority. They run a tiny image that does nothing, with resource requests sized like the room you want to keep free:
apiVersion: scheduling.k8s.io/v1
kind: PriorityClass
metadata:
  name: placeholder
value: -10
preemptionPolicy: Never
description: "Reserves spare room. Real pods evict these immediately."
---
apiVersion: apps/v1
kind: Deployment
metadata:
  name: capacity-placeholder
spec:
  replicas: 2
  selector:
    matchLabels: { app: capacity-placeholder }
  template:
    metadata:
      labels: { app: capacity-placeholder }
    spec:
      priorityClassName: placeholder
      containers:
        - name: pause
          image: registry.k8s.io/pause:3.10
          resources:
            requests: { cpu: "1", memory: 2Gi }
When real pods need the space, the scheduler preempts the placeholders (that’s the priority and preemption section of part 2 doing its job), and the real pods start straight away. The evicted placeholders go Pending, which makes the node autoscaler add a node in the background, so the spare room is back a few minutes later. You pay for a little idle capacity, and in return a sudden spike never has to wait for a machine.
The other things that help are less exciting but matter just as much: small container images that pull quickly, apps that start fast, readiness probes that pass as soon as the app can really serve traffic, and accurate requests, so the autoscalers’ maths reflects reality.
Scaling down without dropping requests
Scaling down is where autoscaling can quietly hurt users, because removing pods and nodes means killing things that are in the middle of work.
A PodDisruptionBudget tells Kubernetes how many replicas must stay up during voluntary disruptions like a node being drained:
apiVersion: policy/v1
kind: PodDisruptionBudget
metadata:
  name: web
spec:
  minAvailable: 2
  selector:
    matchLabels:
      app: web
Both node autoscalers respect PDBs when they drain a node, so they won’t take all your replicas down at once. Just don’t set a PDB that can never be satisfied (like minAvailable equal to the replica count), or nodes will never drain and scale-down silently stops.
Then make sure the pods themselves shut down gracefully. When a pod is told to stop, it gets SIGTERM and has terminationGracePeriodSeconds (30 by default) to finish what it’s doing before it’s killed. Your app should stop accepting new work, finish in-flight requests and exit. Load balancers can take a few seconds to notice a pod is going away, so a short preStop sleep is a common way to avoid sending requests to a pod that’s already shutting down.
When autoscaling doesn’t happen
Here’s what I check when something isn’t scaling the way I expect:
kubectl describe hpa <name>. The conditions and events usually say exactly what’s wrong: “missing request for cpu”, “failed to get cpu utilization”, or “the desired replica count is more than the maximum”.kubectl top pods. If this fails, metrics-server isn’t running or isn’t healthy, and the HPA is blind.kubectl get hpa -wwhile you generate some load, to watch the current value and replica count change live.- If pods are stuck in
Pending, check the node autoscaler. For the Cluster Autoscaler, look at its logs and at the events on the pending pod for messages like “pod didn’t trigger scale-up”, which usually means no node group could fit it or a group is already at its maximum size. - If nodes never scale down, look for pods blocking the drain: an impossible PDB, pods with local storage, or pods annotated
cluster-autoscaler.kubernetes.io/safe-to-evict: "false".
Wrapping up
Each autoscaler only handles one layer, and each one depends on the layer below. The HPA needs sensible requests to measure against. New pods need room on the nodes. The node autoscaler needs time, which overprovisioning can hide. When those line up, the cluster grows and shrinks with the traffic.
Next in the series: the Gateway API, and why it’s replacing Ingress.
Thanks for reading! If you have questions or spot a mistake, find me on twitter.